
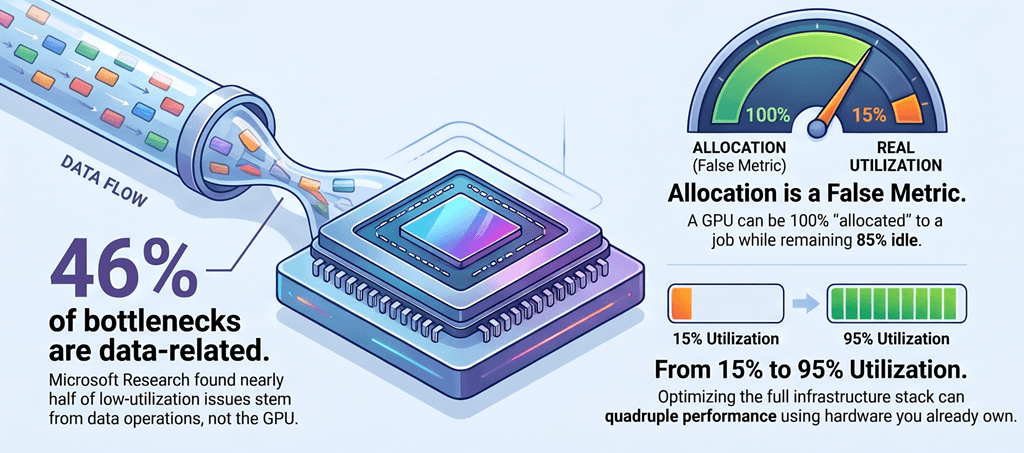
GPU resource starvation is one of the most expensive problems in AI infrastructure. Dashboards may show 100% GPU allocation. However, real utilization can sit near 15% when CPUs, storage, memory, or networking cannot keep up.
As a result, expensive GPUs wait instead of doing useful work.
Microsoft Research found that 46.03% of low GPU utilization issues came from data operations, not the GPU itself. Therefore, teams need resource-aware scheduling, per-resource monitoring, and right-sized provisioning before they buy more GPUs.
That gap between allocation and real work is where many AI teams lose performance and budget.
What Causes GPU Resource Starvation?
Every training job needs CPU cycles, memory bandwidth, network throughput, and storage I/O. When a scheduler tracks only GPU count, it misses the full resource profile.
If the scheduler assigns GPUs without reserving those co-resources, other jobs can create contention. Then performance drops, even though the GPUs still look allocated. A Microsoft Research study tied 46.03% of low-utilization issues to data operations.
The Alliance’s 2024 State of AI Infrastructure report found that 74% of companies value unified compute and scheduling. However, only 19% use tools that can view queues and improve GPU utilization.
That matters because more GPUs will not fix a CPU, network, or storage bottleneck. Instead, the team keeps the same constraint and increases the cost.
Where GPU Starvation Usually Starts
Crusoe’s infrastructure team makes the point clearly: “the GPU itself is rarely the problem.” A slow data pipeline, congested network, or overloaded CPU can starve the GPU before the model runs efficiently.
The table below shows common starvation points and their business impact.
| Resource | Common Cause | Business Impact |
|---|---|---|
| Storage I/O | Slow reads, undersized caches, high metadata overhead | GPUs sit idle waiting on data |
| Network | Bandwidth limits, latency, packet loss | Slower distributed training |
| CPU / preprocessing | Too few cores, inefficient data preprocessing | GPUs wait while data is decoded and prepared |
| Memory | Limited host RAM or memory reserved for data transfers | Slower data transfers to the GPU |
| System contention | Container limits, oversubscribed hosts | Jobs compete for the same resources |
What GPU Starvation Looks Like in Production
GPU starvation often looks normal on standard dashboards. Allocation shows 100%, but a GPU running at 15% utilization sits idle most of the time.
The job status says “running.” In addition, the logs may show no obvious errors. Therefore, the real signal is utilization, not allocation.
| Observable signal | What it usually implies |
|---|---|
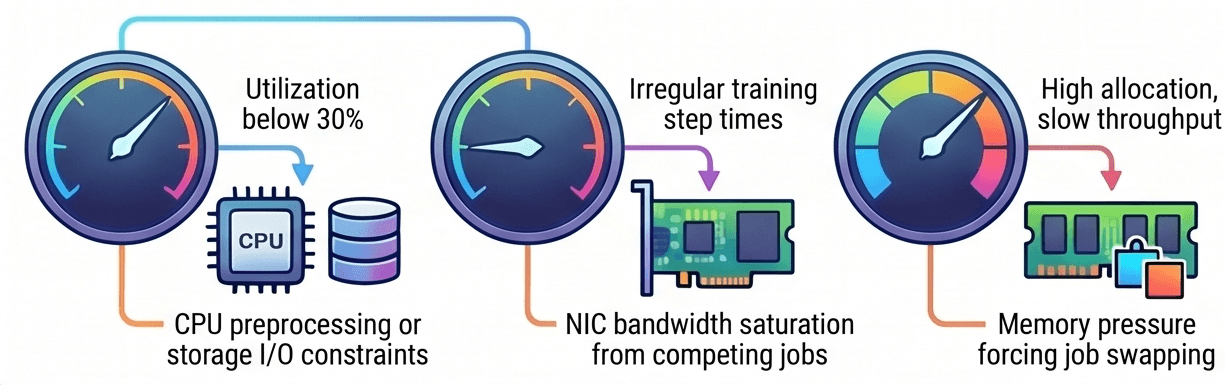
| GPU utilization below 30% during active training | CPU preprocessing bottleneck or storage I/O constraint |
| Irregular training step times | Network bandwidth saturation from competing jobs |
| High allocation, slow throughput | Memory pressure is forcing swapping between jobs |
| GPU utilization below 80% during data loading | Storage throughput cannot match GPU processing speed |
A slow data pipeline is often the first problem to check. When storage delivers data too slowly, preprocessing takes longer, and GPUs wait. The GPU did not fail. The infrastructure around it did.
Buying more GPUs does not fix that bottleneck. It only makes the problem more expensive.
Three Fixes That Improve Real GPU Utilization
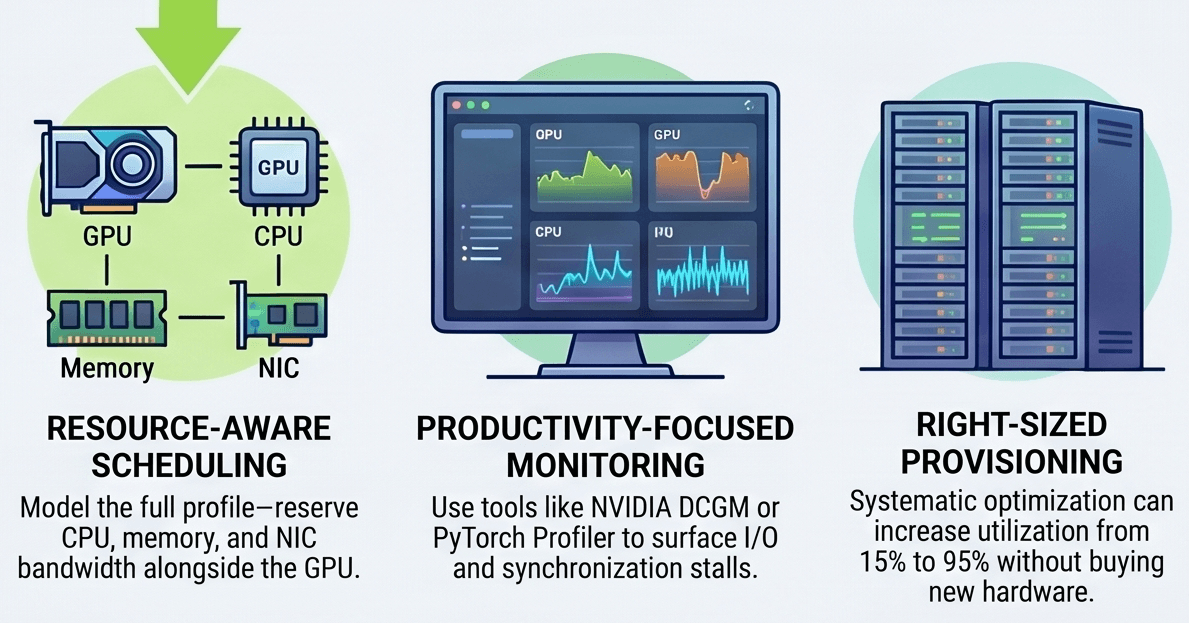
Fixing GPU starvation takes three layers working together: resource-aware scheduling, per-resource monitoring, and right-sized provisioning.
- Use resource-aware scheduling. The scheduler must model the full job profile, not only GPU count. It should reserve CPU cores, memory, network bandwidth, and storage I/O with the GPU request. Purpose-built schedulers such as Volcano and NVIDIA KAI Scheduler support AI workload placement beyond basic GPU assignment.
- Monitor every resource, not only GPUs. GPU utilization does not equal GPU productivity. Effective monitoring should surface CPU saturation, storage I/O limits, network contention, and memory pressure. Tools like NVIDIA DCGM Exporter and Prometheus can reveal signals that allocation dashboards overlook.
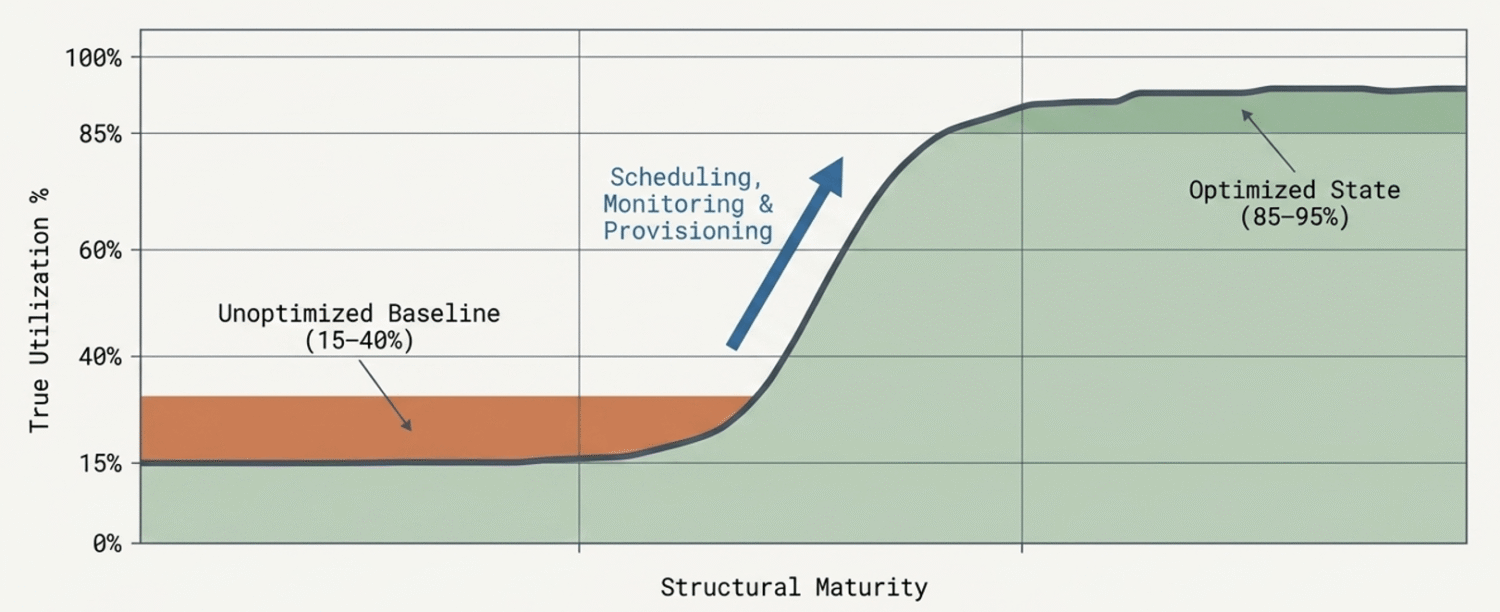
- Right-size the full infrastructure stack. Match CPU, memory, storage, and networking to GPU demand. Spheron’s GPU capacity analysis notes that unoptimized workloads often use only 15% to 40% of available GPU capacity. Teams can often raise utilization with better scheduling, monitoring, and provisioning without buying more hardware.
Three Key Takeaways
Which co-resources most often cause GPU starvation? CPUs and storage often create the first bottlenecks. In distributed training, network bandwidth can also become a major constraint. Microsoft Research found that many low-utilization issues start in data operations, not GPU compute.
How do you identify the real bottleneck? Start with step-level profiling. If utilization drops during data loading, check storage and CPU first. If it drops during synchronization, check network bandwidth or memory pressure. Then confirm the issue with PyTorch Profiler, NVIDIA Nsight, or DCGM.
How much utilization improvement is realistic? Many teams can improve utilization by fixing scheduling, monitoring, and provisioning gaps before adding hardware.
Unoptimized workloads often use only 15–40% GPU utilization. Teams can often raise that to 85–95% with better scheduling, monitoring, and provisioning, using hardware they already own.
Next Steps
If your GPU dashboard shows high allocation but low utilization, do not start with another GPU purchase. Start with the system around the GPU. Measure the data path, CPU pressure, memory behavior, and network flow. Then tune the scheduler and provision the full stack around the workload.
If your AI infrastructure looks fully allocated but still feels slow, it may be time to review the full resource profile. HighFens helps teams assess GPU utilization, scheduling, storage, and data pipeline bottlenecks before they spend more on hardware.
Which co-resource bites first in your environment: CPU, storage, or network?