
Your dashboard says your GPUs are busy. Your training pipeline may tell a different story. Many teams trust allocation numbers. If a cluster shows 90% or 95% allocation, it looks efficient. However, allocation only shows which GPUs were reserved. It does not show whether those GPUs performed useful compute work.
To understand real efficiency, teams need to separate two metrics: GPU allocation and GPU utilization.
GPU Allocation vs. GPU Utilization
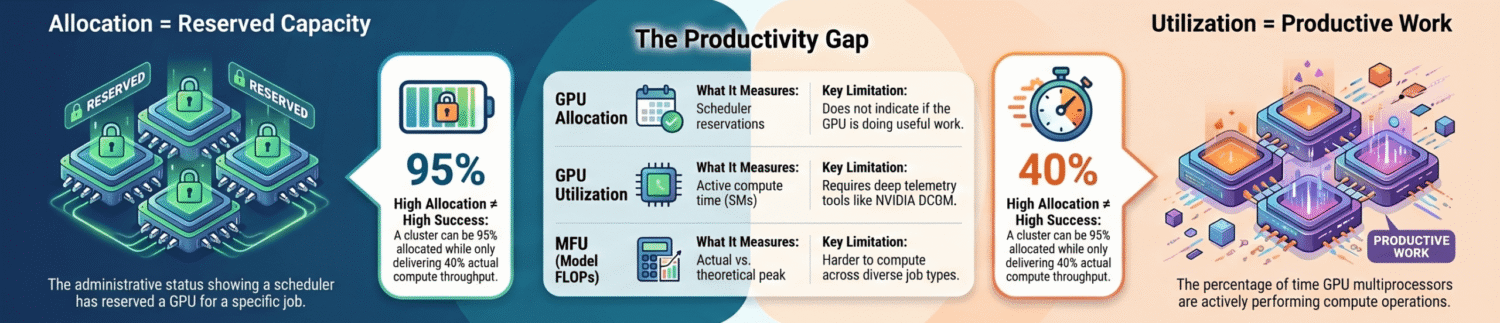
GPU allocation measures whether a scheduler reserved a GPU for a job. GPU utilization measures whether the GPU performed active compute work.
Therefore, a cluster can show high allocation and low utilization simultaneously. Teams may pay for GPUs that sit idle during data loading, synchronization, or startup delays. As a result, they optimize the wrong number and miss the bottleneck.
High allocation creates false confidence because it treats reservation as productive work. When a scheduler assigns a GPU, the dashboard marks it as in use. However, that status does not prove the GPU is computing.
NVIDIA Data Center GPU Manager (DCGM) helps clarify this gap. DCGM provides job-level GPU telemetry, health data, and performance information. In other words, reservation data alone cannot explain whether expensive GPUs deliver useful throughput.
Why High GPU Allocation Misleads AI Teams
Many AI teams still use allocation as their main scheduling metric. If the dashboard shows 90% or 95%, the cluster looks healthy. Capacity appears tight.
However, engineers often see something different. Jobs run slowly. Queues stay long. Throughput falls short of expectations. That gap exists because allocation and utilization measure different things. Google’s Borg paper explains how large-scale clusters improve utilization with scheduling and packing policies. Still, cluster-level efficiency does not prove that every assigned GPU stays busy.
Why Do Allocated GPUs Still Sit Idle?
A GPU can be marked in use and still do very little. Jobs may wait for data, stall on CPU preprocessing, or block at synchronization barriers. Storage and network contention can also slow each training step. Meanwhile, the scheduler still records the device as allocated.
Consequently, a cluster can appear full even when spare capacity exists. The accounting layer says the GPUs are busy. The workload data says otherwise.
| Metric | What It Measures | Use Case | Key Limitation |
|---|---|---|---|
| GPU Allocation | Whether the scheduler has reserved a GPU for a job | Administrative accounting; chargeback; capacity planning | Does not indicate whether the GPU is doing useful work |
| GPU Utilization | Percentage of time the GPU SM (streaming multiprocessors) are active | Optimization; bottleneck diagnosis; cost efficiency analysis | Requires telemetry tooling (e.g., DCGM, nvml) beyond standard dashboards |
| MFU (Model FLOP Utilization) | Actual compute vs. theoretical peak FLOP/s for a given model | Benchmarking training efficiency; comparing infrastructure configurations | Model and hardware dependent; harder to compute across job types |
What Causes the Gap Between GPU Allocation and Utilization?
- Input pipelines cannot keep GPUs fed with data fast enough.
- CPU resources are undersized for preprocessing or tokenization.
- Distributed jobs spend excessive time in startup or synchronization phases.
- Network and storage contention slow each training step.
- Schedulers reserve GPUs without modeling the full resource shape of a job.
In many environments, the input pipeline causes a large share of idle GPU time. When storage throughput cannot keep pace with compute demand, GPUs wait instead of training. This gap is not only technical. It is expensive.
The Cost of Low GPU Utilization
When a cluster is 95% allocated but only 40% utilized, the business pays premium prices for idle compute time. Worse, teams may ask for more GPUs instead of fixing the inefficiencies that block utilization. As a result, an optimization problem becomes a capital spending problem.
AI infrastructure spending continues to rise as organizations add more GPUs. However, additional hardware can mask inefficiency when teams lack visibility into utilization. If teams cannot see idle time inside allocated jobs, they over-provision capacity and miss the real bottleneck.
This is one reason AI programs can feel expensive before they become productive. The cluster looks full, so teams assume they need more hardware. In many cases, the real issue sits between what the scheduler reports and what workloads actually do.
How to Measure GPU Utilization and Identify Bottlenecks
AI teams should review GPU allocation and utilization together. Allocation shows who owns the GPU. Utilization shows whether the GPU delivers useful performance.
Here is a practical rule. If allocation remains high while average GPU utilization remains low, wasted capacity likely exists within assigned jobs. That waste may come from startup delays, weak co-resource reservations, or queue policies that ignore the full resource profile.
Tools such as NVIDIA DCGM and open-source utilities like nvitop expose per-GPU telemetry. They help teams separate utilization from allocation. NVIDIA Management Library (NVML) also reports GPU and memory utilization, process data, power, thermals, and other device states.

Three Questions to Diagnose GPU Utilization Issues
Use this quick diagnostic when cluster performance starts to drift.
- Are GPUs highly allocated according to the scheduler dashboard?
- Are training jobs still slow, or is throughput below expected benchmarks?
- Are job queues staying long despite high apparent capacity?
If all three answers are yes, the cluster likely optimizes the wrong metric. Next, measure utilization, identify the bottleneck, and fix it within the current allocation.
Allocated GPUs do not create value. Utilized GPUs do.

How to Improve GPU Utilization
High allocation does not guarantee productive work. It only shows that a scheduler reserved GPUs. To improve throughput and return on investment in AI infrastructure, teams need to measure utilization, identify bottlenecks, and optimize what happens within each job.
If this pattern sounds familiar, start with one question: Are your GPUs busy, or just reserved?
Three Practical Takeaways
What is the difference between allocated and utilized GPUs?
Allocated GPUs are reserved. Utilized GPUs perform compute work. A GPU can be fully allocated and still sit mostly idle. Therefore, a cluster can look full while throughput stays low.
Why can GPU allocation stay high while utilization stays low?
Jobs often hold GPU reservations while they wait for data, CPU work, synchronization, or network access. The scheduler still marks those GPUs as busy. Utilization tools such as NVIDIA DCGM show what the hardware is doing.
How much does low GPU utilization cost in practice?
Low GPU utilization adds up fast. GPUs are expensive, and idle time compounds across jobs and clusters. Therefore, utilization monitoring matters for cost, performance, and AI project ROI.
HighFens helps AI teams measure the gap between GPU allocation and utilization, then fix the bottlenecks that slow production workloads. Contact us at sales@highfens.com to review your AI infrastructure.